A direct view into you systems....
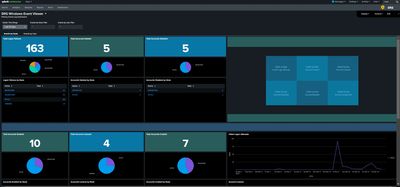
What is Splunk?
Splunk is a powerful software platform used to search, monitor, and analyze machine-generated data in real time. It collects logs and events from systems, applications, and devices across your network—like servers, firewalls, and containers—and turns that raw data into useful insights through dashboards, alerts, and reports. IT teams use Splunk for troubleshooting, cybersecurity, system monitoring, and compliance auditing. It helps you quickly detect problems, track trends, and respond to security incidents. Splunk is especially useful in large environments where keeping track of logs manually would be impossible.
Features
Many features of Splunk like Data Collection & Ingestion, Search & Querying, Data Indexing & Storage, Dashboards & Visualization, Alerting & Monitoring, Security & Compliance, Observability & IT Operations, Cloud & Hybrid Deployments, Integration & Extensibility.
Architechure
Splunk's architecture is designed to handle vast amounts of machine data in real-time, providing the infrastructure necessary for data collection, indexing, searching, and analysis. The core components of this architecture include Forwarders, Indexers, and Search Heads, each playing a vital role in the overall system's efficiency and scalability.
Why use Splunk ?
Splunk is a powerful platform for collecting, analyzing, and visualizing machine data in real-time. It helps businesses turn raw logs and events into actionable insights, improving security, IT operations, and business analytics. You can generate scheduled reports and even set alerts!
Installation Tips
When installing Splunk, selecting the right architecture is critical to ensure optimal performance and scalability. The architecture depends on factors like the volume of data, the number of users, and the desired availability.
Basic Setup
Data Locks - Getting Splunkd
Taking a deeper look into Splunk and sharing some pointers. Other than the simplicity of centralized logging, real-time monitoring is the ability to try before you buy. I currently run Splunk in house using the limted free licnese. It is limited to 500MB of data per day but that’s quite a bit of information and perfect for testing or lab environments.
The setup of a basic Splunk server is quite simple; there is support for MS Windows, Linux and Containers.
Post Installation Steps:
- Splunk Host: Verify port 8000, 9997 & 514 is open if running a firewall
- Splunk Server: Verify the Forward and Receiving \ Receive Data is enabled (9997)
- Splunk Server: Under Data Inputs add TCP\UDP Port 514
- Splunk Server: You can create custom index, or items will default to "main"
- Splunk Server: If you plan on using the free license, select that at time of installation and it will change to an auto login. The default login is "admin" and "changeme".
Note:
- Port 9997 is the default for the universal forwarder
- Port 514 is the default port for syslog traffic
- Port 8000 is the default port for Splunk web interface
You can test out Splunk and run Splunk on Windows workstations or run it as a
container on Linux which has been my preferred solution.
